Capture UI & requests
Capture combines client tabs, a request list, and a detail pane. DevPeek layers param encrypt/decrypt, visual Mock, and response-body search into everyday workflows—the sections below walk the UI; try Mock and param transform from the list context menu and settings.
Demo
Filter requests and inspect details
Use client tabs, protocol/method filters, and keyword search to find a request, then inspect details and resend it.
Client tabs
Tabs are keyed by source IP: one tab per proxied client. Reorder by drag-and-drop; newly seen IPs are appended at the end (order does not follow request arrival jitter).
- Labels usually show the client IP; loopback/localhost may read as a localized “this machine” style label.
- Closing a client tab clears that IP’s rows from the capture list and hides the tab; forwarding through the proxy is unchanged—only UI state and loaded list data.
- Different phones on the same Wi‑Fi, or multiple containers/VMs on one PC, appear in different tabs whenever their source IPs differ.
- When no client tab is available, the list may show all loaded sessions without a single-IP filter—follow what the running app shows.
Request list
The left column lists sessions for the current context: first scoped by the active client tab, then shaped by tree layout, sort order, and the filters below.
List context menu
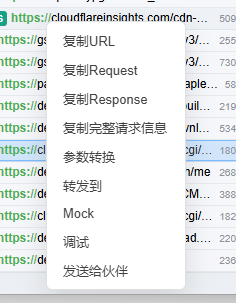
Right-click a row to use **that request as a template**: DevPeek prefills URL, query, body, headers, and more so you do not retype match conditions—handy for creating rules or debugging from real traffic.
- **Mock / param transform**: open the visual wizard, pick match features from the request, then save.
- **Forward to…**: prefills the request Host to locate or create a forward rule.
- Also copy URL / full message, open **Debug API** to edit and resend, or **Send to peer**.
Context menu shortcuts: template a row into Mock, param transform, or forward rules, plus debug and collaboration.
Tree layout
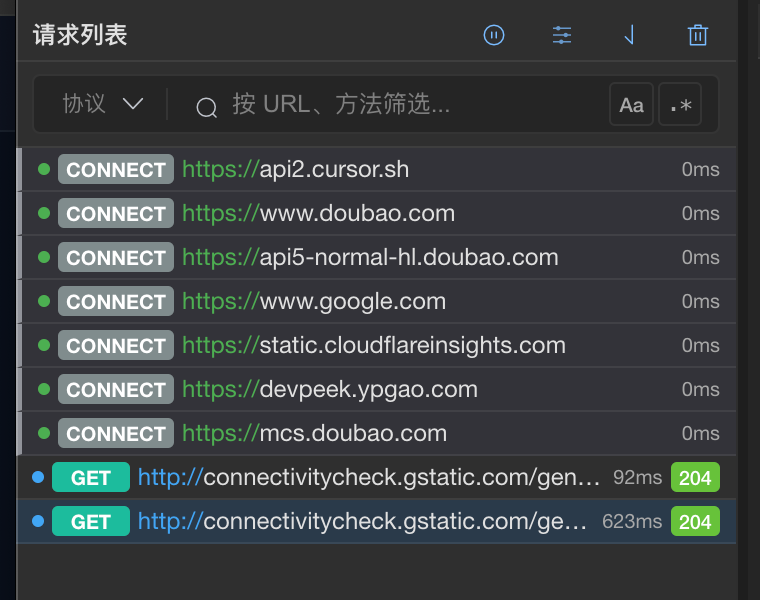
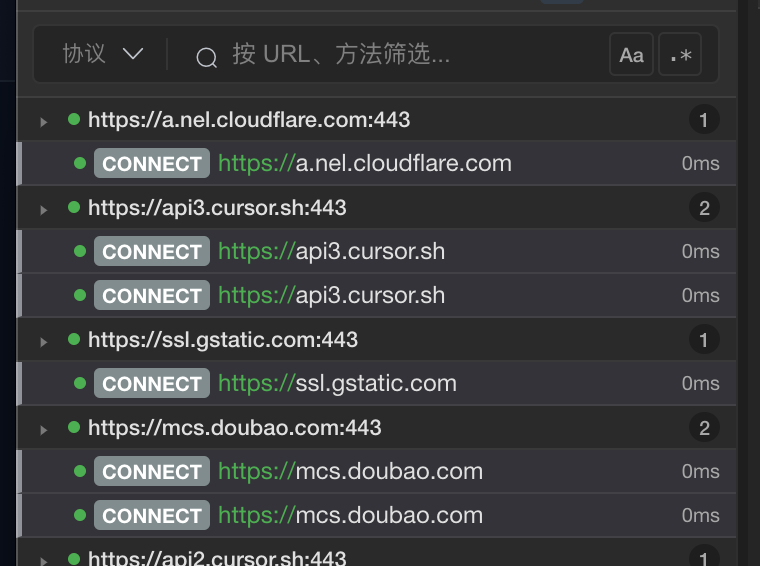
Group rows by protocol plus host; click group headers to collapse or expand. The tree toggle can be persisted in-app.
Two views of the same list area: flat rows on the left, tree grouping on the right (shown side by side for comparison; in the app you toggle between modes).
Sort
Default is newest-first; toggle oldest-first from the list header.
Filter & search
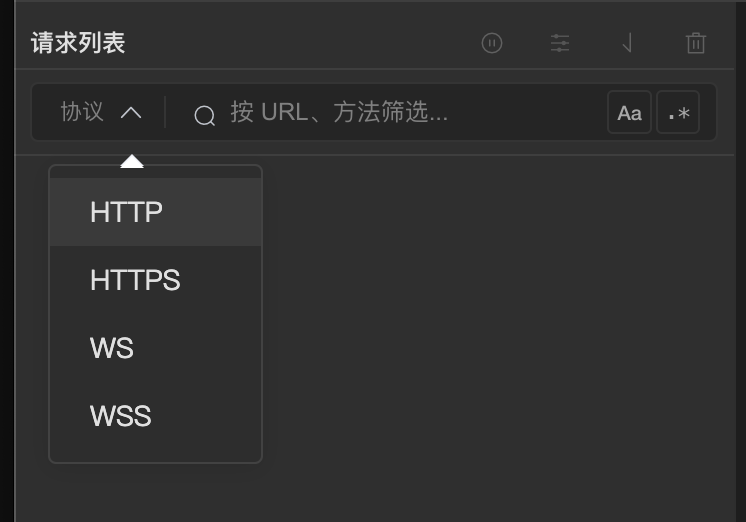
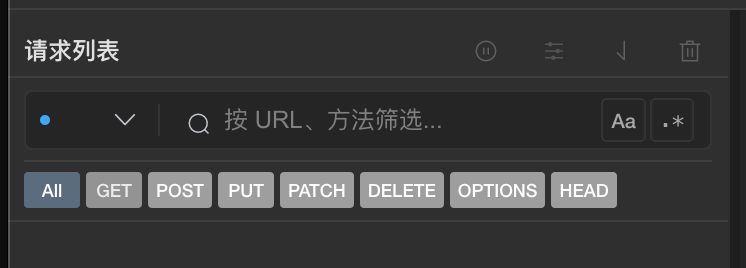
Filter by protocol (HTTP, HTTPS, WebSocket, etc.) and method (GET, POST, etc.). Keywords match URL, Host, and method; optionally include response bodies in the search scope. Case and regex supported. Filters apply to the active client tab only.
Below left: protocol chips you can toggle together. Below right: when HTTP or HTTPS is checked, the per-method sub-filter appears and combines with the protocol chips.
Clear vs close tab
The trash/clear action (when enabled) clears server-side rows for the selected client only and does not hide the tab. The × on a tab clears that client and hides the tab; traffic from that IP may recreate the tab later.
Recording, capture view, and SSL
The **proxy recording** switch controls whether new requests are added to the capture list (when off, new rows usually are not created and Mock cannot attach to new traffic). The proxy still forwards traffic. With SSL decrypt on and the host allowlisted, HTTPS is decrypted and bodies are visible. Otherwise HTTPS may appear as an encrypted tunnel row with a note that the body was not decrypted. Recording is independent of being on the Capture screen: leaving Capture usually stops Mock interception, but recording can still append rows if left on.
Per-client list pause
When a client tab is selected, you can pause its list refresh and skip Mock for that client to reduce noise.
Insert order and scrolling
New sessions usually appear at the top. When the Mock tamper dialog selects a pending row, the list scrolls it into view.
Row chrome
Colored dot: application protocol (HTTP, HTTPS, WS, WSS—commonly blue/green/orange/purple).
Method badge: colored HTTP verb (GET, POST, …).
Status badge: shown when a status code exists; color hints 2xx / 3xx / 4xx / 5xx bands.
Rows that matched a Mock rule show an amber inset border. After disconnect or wait timeout during Mock, the row may get a gray left bar and muted styling. In tree mode, leading blank space is indentation, not status.
Detail pane (capture)
With a row selected, the right pane shows that session—headers, bodies, and param transform output are **read-only**. Manual Mock tampering happens in the full-screen **Mock tamper** dialog (see Mock/Breakpoint), not in the detail pane. If the client disconnects or Mock wait times out, a gray reason bar may appear above the main tabs.
Layout and action bar
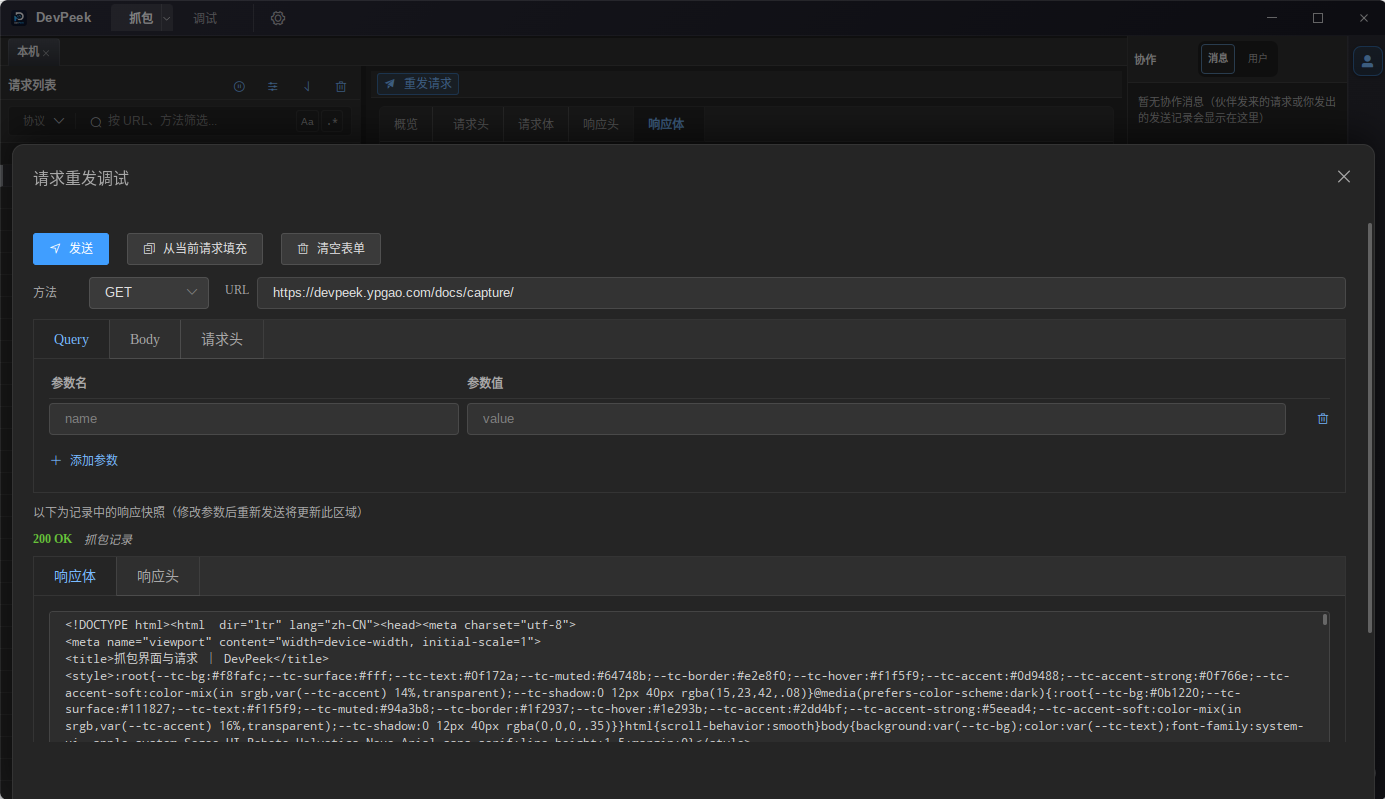
When a session is selected, a **Debug** button can appear at the top of the detail column, opening the **Debug API** drawer prefilled from the current row (same as list context menu).
When switching rows in the list, the detail pane keeps your scroll position for continuous reading; scroll to the top yourself when you want a fresh view.
Main tab bar
Five main tabs: Overview, Request headers, Request body, Response headers, Response body. When you click different rows in the list, the app generally **keeps the active tab** (e.g. stay on Response body to compare payloads).
- Overview: key fields at a glance.
- Request / response headers: read-only.
- Request / response bodies: Preview, Raw, Transform inner tabs—read-only.
Overview (shared metrics)
Overview shows client IP, method, Host, status code, duration, and full URL for a quick scan.
- Client IP: traffic source; loopback may read as a localized “this machine” label.
- HTTP method: matches list badges.
- Host: matches the URL host.
- Status: colored bands for 2xx / 3xx / 4xx / 5xx.
- Duration: milliseconds; shows an em dash when unknown.
Request and response headers
Read-only request and response headers for copy and comparison. Mock edits happen in the Mock tamper dialog.
If there is no content, you see an empty state.
Request and response bodies (inner tabs)
Inner tabs include Preview, Raw, and Transform (when rules apply). All read-only—Mock edits happen in the tamper dialog.
When switching rows, your chosen inner tab generally stays put for easier comparison.
Response body defaults to Preview when you switch rows; switch to Raw manually when you need raw text.
- Request body: uplink content; param transform output appears under Transform.
- Response body: downlink content.
Tips for comparing many requests
Combine “top tab stays put” with Overview metrics:
- Latency sweep: pin Overview, click rows, read duration + status colors only.
- JSON bodies: pin Request body on Raw or Preview and step through rows.
- Responses: pin Response body; switch to Raw when you need raw text.
Mock tamper dialog
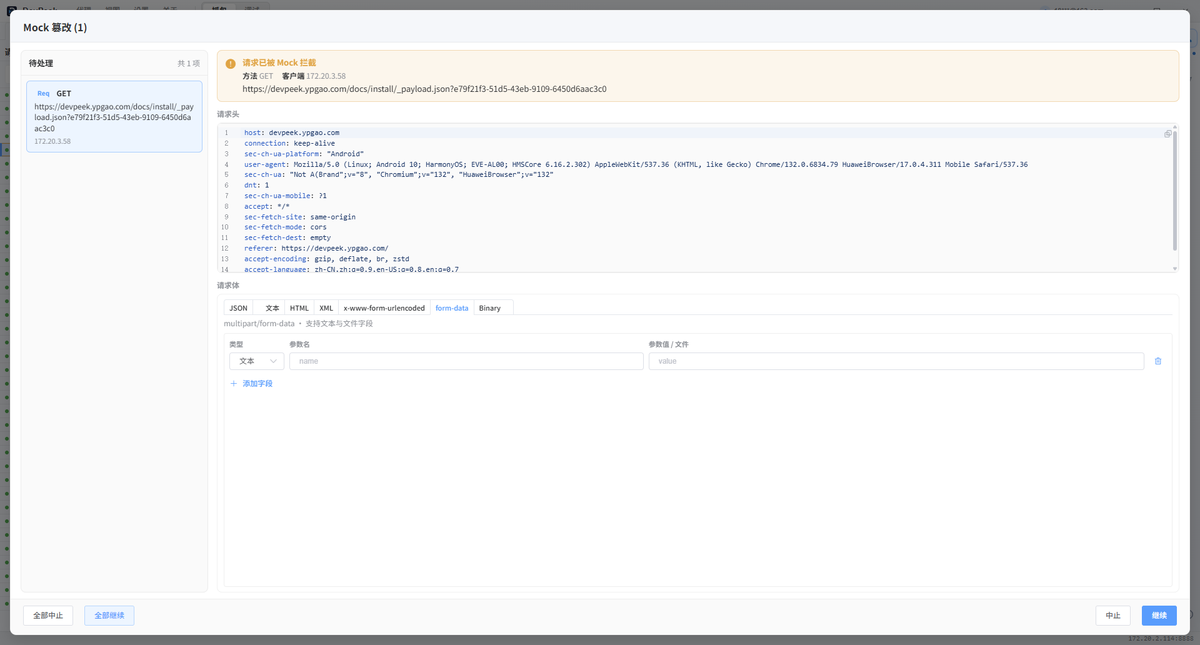
When **manual Mock** hits, a full-screen **Mock tamper** dialog opens (title shows pending count). It auto-opens while items are pending and cannot be dismissed via overlay click, Esc, or the close button; it closes when the queue is empty. Edit headers/bodies in the dialog, then Continue or Abort for the current item; footer actions also offer Continue all / Abort all.
- Left **Pending** list: request / response stages in order, with method, URL, and client IP.
- Right editor: headers and body. Rows bound to param transform default to **plaintext**; DevPeek encrypts before Continue.
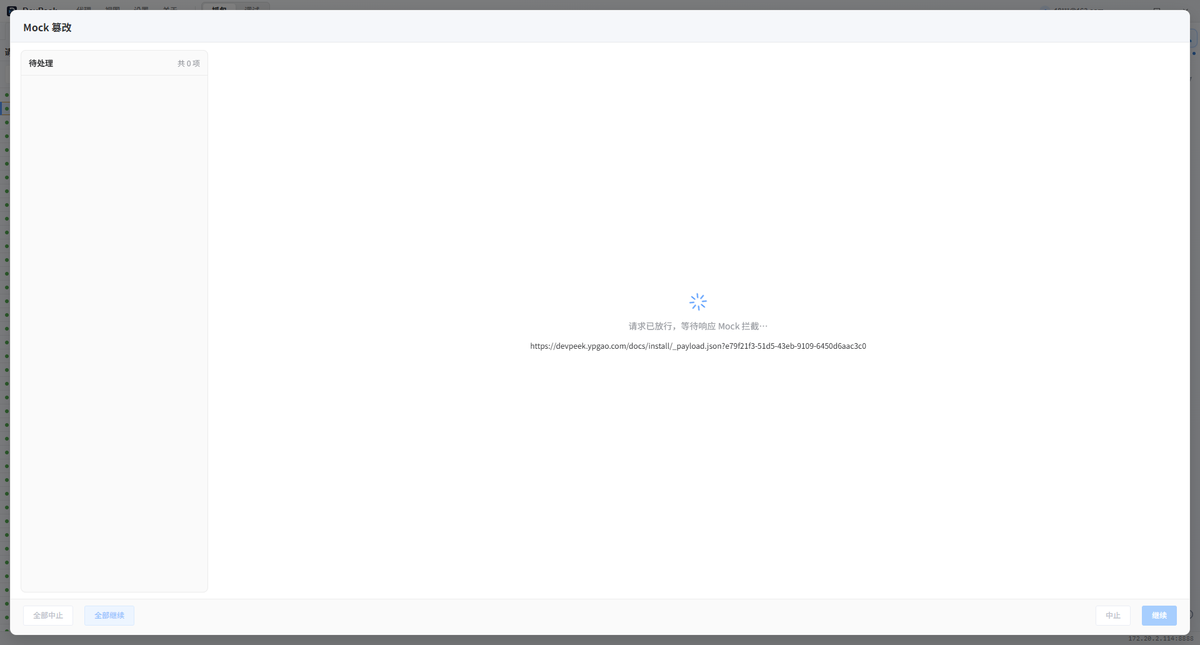
- Rules with both request and response: after request Continue, wait for the origin response, then edit the response.
- Dialog ↔ list sync: switching queue items selects and scrolls the matching row; after continue, the read-only detail pane refreshes for side-by-side review.
The dialog is **not tied to the active client tab or main window tab**: whether you are on **Capture** or **Debug**, and whichever device tab is selected, it auto-opens while items are pending—same proxy chain as the capture list and Debug tab Network. Only per-client **list pause** skips Mock matching for that IP.
Manual Mock in two phases: edit request headers/body in the dialog; after Continue, if the rule includes a response stage, wait for the origin response before editing it.
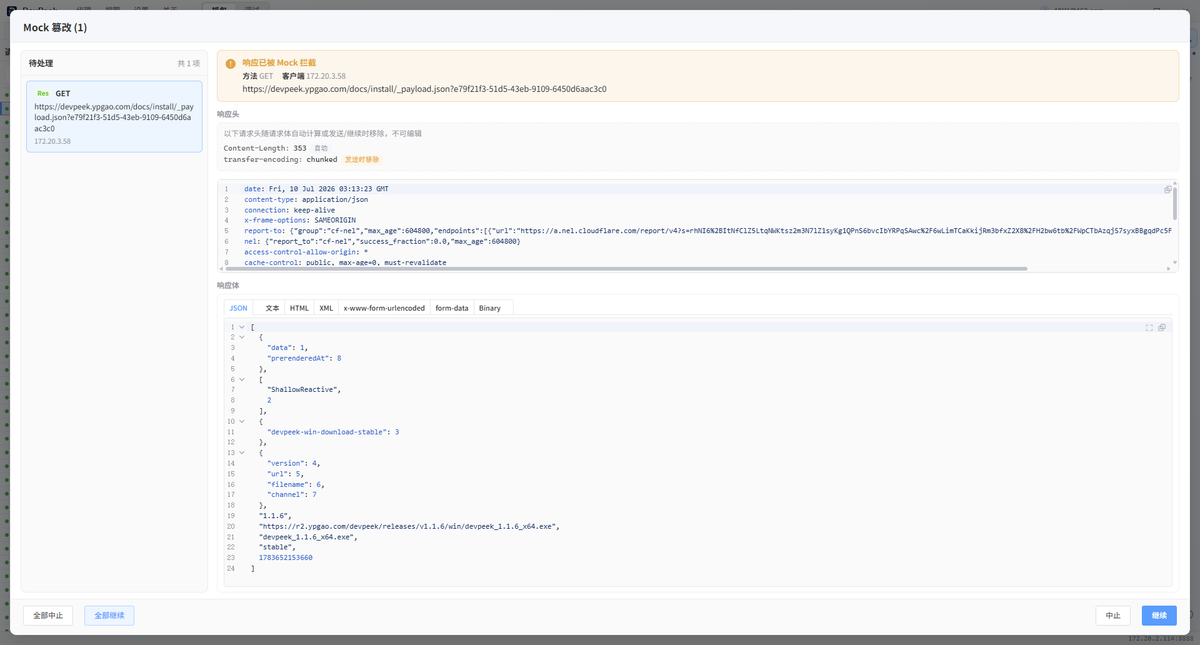
Detail pane vs dialog
The detail pane stays read-only for original / preview / Transform views—**do not edit Mock content there**.
If the client disconnects or Mock wait times out, a gray reason bar may appear above detail tabs and the list row is muted. Clearing pending items on close may surface a toast.
List selection and detail top tab
When a new Mock pause is queued, the app selects the session, scrolls the list, and switches the detail **main tab** for quick review: request phase prefers Request body (else Request headers); response phase prefers Response body (else Response headers).
This alignment helps you read capture data while the dialog is open—it is **not** in-detail editing. Manually clicking another paused row applies the same top-tab rules.
Enabling and matching Mock rules
The Mock library can store many rules and **enable several at once**. The proxy walks the list **in order** and **stops at the first hit**. Tick rules under **Proxy → Start Mock** (✓ = enabled); the sidebar Mock panel offers quick toggles. Manual/auto Mock, tamper versions, and more are covered in the Mock guide.
Continue / Abort and the queue
After Continue or Abort on the current item, if more items remain, the dialog selects the next pending entry in order.
Continue all / Abort all batch-process every pending row in the left list. When done, the dialog closes; list selection remains for review.
If the Debug API drawer is open when Mock hits, auto-select/scroll is deferred until the drawer closes.
Debug API (in-place)
The detail Debug button **debugs the API in place**: open the bottom drawer prefilled from the current row—no copy/paste into Postman or similar tools. Body modes include none, JSON, plain text, x-www-form-urlencoded, multipart (text/file), and binary file. Query / JSON fields with param transform and re-encrypt enabled show **plaintext**; DevPeek writes ciphertext on Send. Undecrypted HTTPS tunnels may block send with an inline reason. Response snapshots update in the drawer after each send.
One-way decrypt-only configs show read-only plaintext in the drawer with a hint to enable re-encrypt in conversion config—see Param transform.
Open from the detail **Debug** button or list menu. Edit URL, query, body, and headers, then Send; bound fields show plaintext and encrypt automatically. Response snapshot updates below after each send.