Mobile web debugging
Page debugging mirrors phone web pages through DevPeek’s proxy on your desktop, using built-in debug panels—not browser DevTools. Before you start: proxy on the device, trust the DevPeek root CA, and the host in SSL decrypt scope—otherwise the preview may stay on “Waiting for device connection” and never mirror. The Chromium-based browsers on your PC extension is optional for PC browsers; Record and Timeline replay are optional.
Demo
Mobile web debugging over the proxy
Phone traffic through the proxy with SSL ready: pick the client tab in Debug, refresh the page to auto-connect and mirror, use DevPeek’s built-in debug panels.
Before you start
Mobile web debugging depends on the full proxy path—it is not standalone. Check this list before opening the Debug tab:
- Phone / tablet Wi‑Fi (or test env) HTTP(S) proxy points to your DevPeek PC IP and listen port; same LAN and reachable port.
- Install and fully trust the DevPeek root CA on the mobile device (iOS: also enable trust in Certificate Trust Settings; Android: user CA plus app trust rules).
- Add target hosts to the SSL allowlist; Capture should show decrypted HTTPS and HTML pages—not only undecrypted tunnel rows.
See Proxy & HTTPS / certificates and Capture UI & requests for details.
Entering debug
When the checklist passes, open the Debug tab and pick the target phone in the top client tab (shared with Capture). If that client tab is missing, browse the target page through the proxy on the phone first and confirm traffic appears under Capture.
Refresh the current page in the phone browser (or open the target URL again). If the page is injectable HTML document fetched through the proxy, DevPeek auto-connects and mirrors it in the preview. Until then, the preview shows “Waiting for device connection”. Content Security Policy limits injectable resources—expect small differences vs the real device browser.
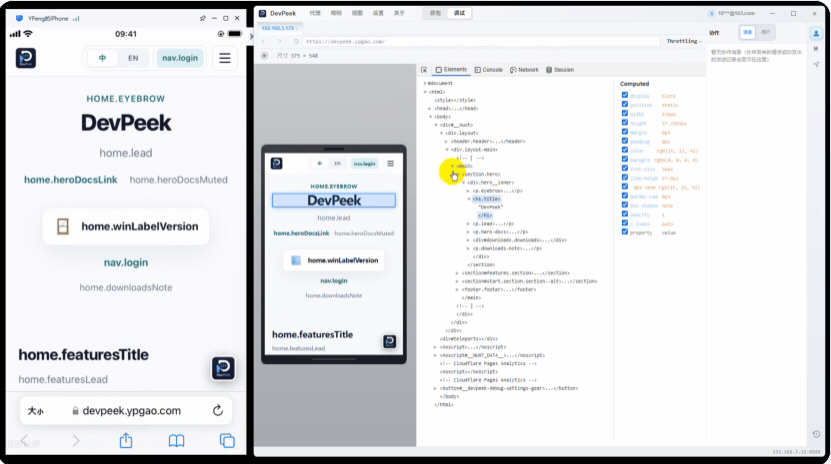
After the device connects: phone mirror on the left, built-in debug panels (Elements, Console, Network) below.
Tooling
- The toolbar has Back, Forward, and Reload; type a URL and press Enter to navigate the real device browser (requires an active connection). Size is read-only and shows the device viewport.
- Throttling: built-in presets or the same custom numbers as global throttling.
- Switch the top client tab to bind another client.
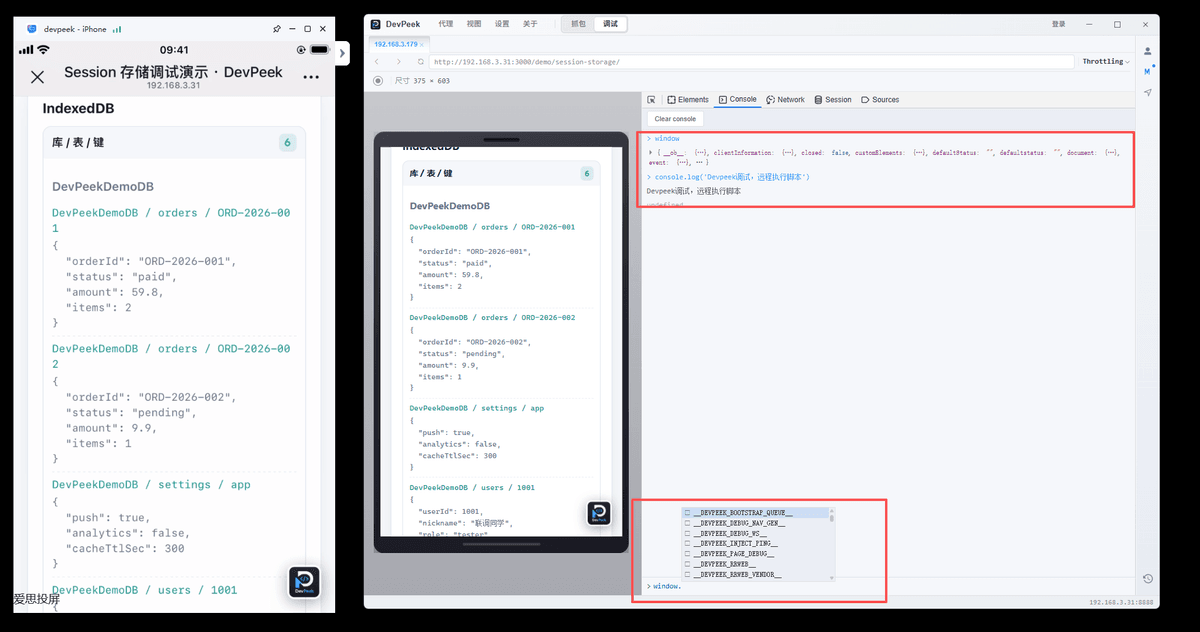
- DevPeek’s built-in debug panels below—Elements (DOM), Console, Network, Session (cookies, localStorage, sessionStorage, IndexedDB, and more)—designed for proxied page mirrors.
The Console tab streams page logs and lets you eval scripts in the real page context—with autocomplete.
Network panel & in-place Debug API
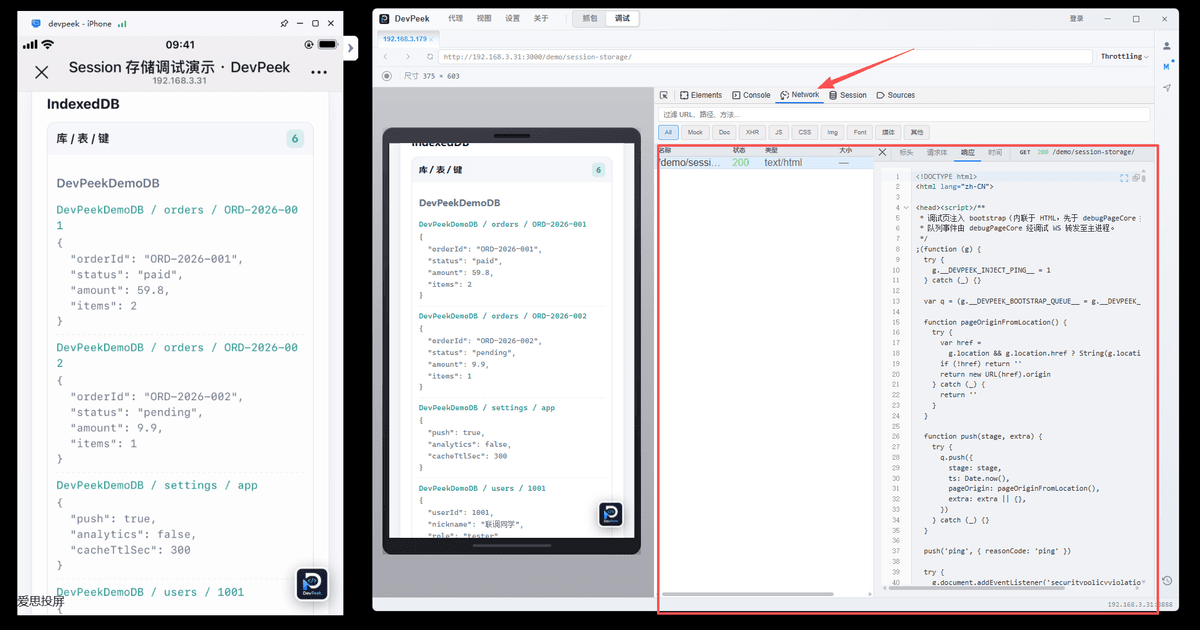
The debug **Network** tab lists requests from the mirrored page through the proxy (same source as Capture). Inspect headers, bodies, responses, and **param transform** output—encrypted APIs show decrypted plaintext once rules are configured.
To resend with edits, **don’t** copy query/body into Postman: switch to the Capture tab, select the same client and row, then open **Debug API** from the detail Debug button or list context menu—edit plaintext and Send (DevPeek encrypts automatically). See Capture UI & requests and Param transform.
Select a row in Network to inspect headers, body, and response in the detail pane—same data source as Capture.
Record a debug session
Use Record in the preview. Switching clients, leaving the route, or closing without saving may discard in-progress recordings with a warning. Saved sessions land in the History sidebar list.
Recordings & replay (preview)
In the main Debug view, open History for saved recordings. Export JSON, Delete, or Send to a LAN peer (see Collaboration); Repro opens a new window to try replay. Import JSON when the UI offers it. Replay is still evolving—you can solve most issues without it.
Import recording JSON validates files; malformed payloads or missing mirror events may block playback.
The toolbar has Play / Pause and Preview / Edit; keyboard nudges depend on the build’s a11y hints.
Chromium extension capture
On Chrome, Edge, or other Chromium browsers, install the DevPeek extension (store listing title may vary by channel). It records in the active tab without forcing full proxy capture—handy for quick front-end captures.
- Open the popup from the toolbar: Start recording this tab / Stop this tab; multiple tabs can record in parallel with a concurrency hint.
- Talk to desktop DevPeek: after stopping, the extension POSTs to the desktop collaboration HTTP port (same path as importing recordings). Start DevPeek locally first.
- Ports & offline: the extension auto-detects the collaboration port in a scan range; if you changed the collaboration listen port, set the port in the popup. While offline you can still record; data queues locally and auto-upload when DevPeek is up, or manage queued items in the popup.
- Do not record on built-in pages like
chrome://—extensions cannot run there. - After import, entries appear in History like any other recording (replay, export, send—per build).
Page debugging applies to mobile (or other proxied) web pages with correct proxy and SSL setup; preview follows site CSP. Scrub tokens before sharing recordings.